Hanwha Solutions Chemical Division
Hanwha Solutions Website go
- STEP 1Business Area
- Choose your business area. Please make a selection.
-
- STEP 2Product Name
- Please make a selection. You may search without selecting all categories.
-
- STEP 3Applications
- Please make a selection. You may search without selecting all categories.
-


-


-
06:00 AMI wake up to the chilly morning air. My day starts early but full of energy. EVAEVA is an eco-friendly material with elasticity and softness which makes it ideal for sneaker soles. Its properties of transparency, flexibility and low-temperature sealability also make EVA an ideal material for laminating films and solar-module sheets.
-
09:00 AMLike everyone else, I move among others, picking up my pace, as I make my way into the subway to go to work . CACaustic soda is essential in a wide range of industrial products including paper, textiles, detergents, metals, food and electrical generation. Chlorine is a natural co-product of caustic soda and is used to produce polycarbonates.
-
02:00 PMA cup of coffee cheers me up in the middle of a hectic day. PEA polymer with outstanding physical properties and environmental stability, it is found in many different forms of plastic we use every day. Polyethylene coating applied to paper cups prevent leakage.
-
06:00 PMTime to wrap up! Driving home, my hands tap lightly on the handle. TDIsTDI is a feedstock for PU resin and adhesives. Flexible foams are used in shoes, furniture, automotive components, bedding and toys. Semi-rigid foams are used in car interior materials.
-
11:00 PMTime to rest up for a fresh start tomorrow. Survived another day, good job! PVCPVC has a wide range of residential applications such as wallpapers, flooring materials, window frames, cable sheathing, stationary and toys.
Consolidated
Revenue Unit billion KRW
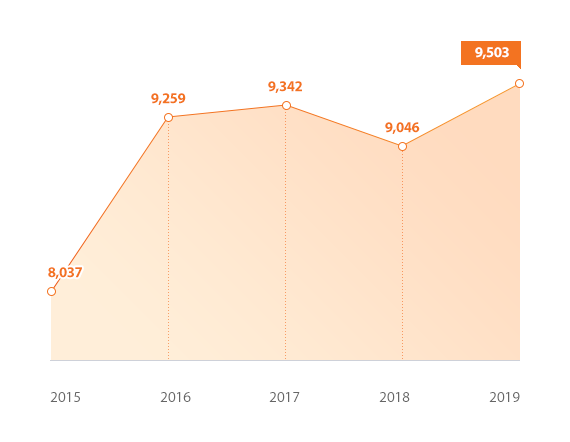
- 2015 : 8,037
- 2016 : 9,259
- 2017 : 9,342
- 2018 : 9,046
- 2019 : 9,503
Net Income Unit billion KRW
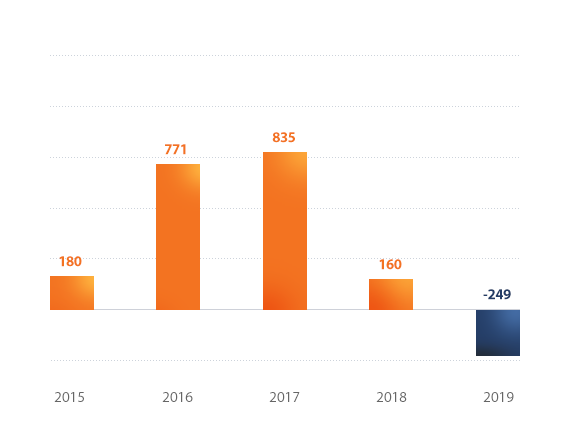
- 2015 : 180
- 2016 : 771
- 2017 : 835
- 2018 : 160
- 2019 : - 249
Consolidated Income Statement
Unit billion KRW| 2015 | 2016 | 2017 | 2018 | 2019 | |
|---|---|---|---|---|---|
| Sales | 8,037 | 9,259 | 9,342 | 9,046 | 9,503 |
| Operating profit | 337 | 779 | 756 | 354 | 378 |
| Net Income | 180 | 771 | 835 | 160 | - 249 |
| Profits attributable to owners of the parent |
188 | 755 | 825 | 187 | - 238 |
Consolidated Balance Sheet
Unit billion KRW| 2015 | 2016 | 2017 | 2018 | 2019 | |
|---|---|---|---|---|---|
| Current assets | 4,778 | 4,524 | 4,222 | 5,012 | 5,323 |
| Non-current assets | 9,075 | 9,294 | 9,427 | 10,219 | 10,358 |
| Total assets | 13,853 | 13,818 | 13,649 | 15,231 | 15,681 |
| Current liabilities | 5,421 | 4,963 | 4,894 | 5,133 | 5,831 |
| Non-current liabilities | 3,500 | 3,387 | 2,568 | 3,871 | 4,044 |
| Total liabilities | 8,921 | 8,350 | 7,462 | 9,004 | 9,875 |
| Controlling interests | 4,633 | 5,285 | 6,015 | 6,090 | 5,728 |
| Non-controlling interests | 299 | 183 | 172 | 137 | 78 |
| Total equity | 4,932 | 5,468 | 6,187 | 6,227 | 5,806 |

